


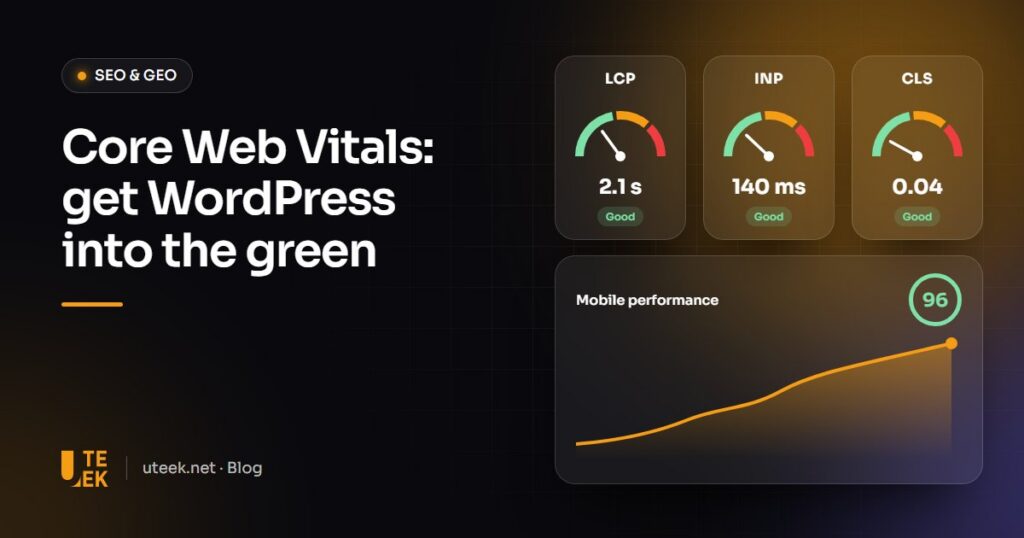
Core Web Vitals are three Google metrics that measure what your visitors actually experience: how fast the main content appears (LCP), how quickly the page responds to interactions (INP) and how stable the layout stays (CLS). A page is rated good when, at the 75th percentile of real visits, LCP is no more than 2.5 s, INP 200 ms and CLS 0.1. On WordPress and Elementor, the work focuses on hosting, caching, images, fonts and JavaScript.
Key takeaways
- Three thresholds: LCP ≤ 2.5 s, INP ≤ 200 ms and CLS ≤ 0.1, assessed separately on mobile and desktop.
- The assessment relies on field data; Lighthouse is a diagnostic tool.
- Hosting, caching, the main image and third-party scripts account for most of the gains.
- Core Web Vitals are one ranking signal among many, not a substitute for content.
What do the three Core Web Vitals measure?
Google defines them in its Web Vitals programme.
LCP: does the main content appear quickly?
Largest Contentful Paint measures the time to render the largest visible block of text or image, often the hero banner. Target: 2.5 s or less.
INP: does the page respond without delay?
Interaction to Next Paint measures how quickly the page responds to clicks, taps and key presses throughout the visit. It replaced First Input Delay (FID) on 12 March 2024. Target: 200 ms or less.
CLS: does the layout stay stable?
Cumulative Layout Shift measures unexpected content shifts, such as a button that moves just as you click. Target: 0.1 or less.
Field data or lab data: which should you look at?
Field data comes from real Chrome users (Chrome UX Report) over a rolling 28-day period. It feeds Search Console’s Core Web Vitals report and the top of PageSpeed Insights.
Lab data comes from Lighthouse: a simulated page load, ideal for diagnosis. With no real interactions, Lighthouse cannot measure INP (Total Blocking Time serves as a proxy), so a good score does not guarantee passing Core Web Vitals.
Causes and fixes on WordPress and Elementor
| Metric | What it measures | Good threshold | Common causes on WordPress / Elementor | Fixes |
|---|---|---|---|---|
| LCP | Rendering of the largest visible element | ≤ 2.5 s | Slow hosting, no cache, heavy or lazy-loaded hero image, slider | Page cache, CDN, prioritised WebP or AVIF image, no lazy loading |
| INP | Responsiveness to interactions | ≤ 200 ms | Too many plugins and add-ons, third-party scripts (chat, pixels), large DOM | Deferred or delayed JavaScript, fewer modules, Flexbox containers |
| CLS | Visual stability | ≤ 0.1 | Images without dimensions, font swap, injected banner | Explicit dimensions, reserved space, preloaded fonts |
How to improve Core Web Vitals on WordPress
Hosting, caching and database
No optimisation can make up for an overloaded server: WordPress recommends PHP 8.3 or newer. Enable page caching: LiteSpeed Cache on a LiteSpeed server, otherwise your host’s cache or a dedicated plugin. A CDN then speeds up visits from further afield. Finally, clear out post revisions, expired transients and options left behind by old plugins.
Images
- Use WebP or AVIF images, resized to their display size.
- Always set width and height to reserve the space.
- Never lazy-load the main image; set its fetchpriority attribute to high. WordPress has done this automatically since version 6.3, but check its choice on Elementor pages.
Fonts
Host them locally, limit families and weights, preload the main font and set font-display to swap or optional.
JavaScript and third-party scripts
This is the main lever for INP: defer non-essential scripts or delay them until the first interaction, remove unnecessary plugins and load chat widgets, advertising pixels and embedded videos only where needed.
Which Elementor settings should you enable?
Options change between versions: check their names in Elementor’s documentation.
- Flexbox containers: fewer nested elements than the old sections and columns, hence a lighter DOM.
- Optimized Image Loading (Performance tab): high priority for the LCP image and lazy loading below the fold.
- CSS Print Method set to an external file, which the browser can cache.
- Lazy Load Background Images and loading Google Fonts locally.
Limit entrance animations above the fold, avoid overlaps with your caching plugin and test each option on a staging site.
What method gets you into the green?
- Measure: find slow URL groups in Search Console, mobile first, then analyse a typical page in PageSpeed Insights.
- Fix the worst templates first: home page, post, product page. Fixing a template improves every page that uses it.
- Check each fix in the lab with Lighthouse.
- Validate in the field in Search Console, which monitors the issue for 28 days.
FAQ
Are Core Web Vitals a Google ranking factor?
Yes, Google states that its ranking systems use them. But its documentation makes clear that Google always seeks to show the most relevant content, even when page experience is sub-par: they mainly separate pages of similar quality.
Why do PageSpeed Insights and Search Console show different results?
The score out of 100 comes from a simulated Lighthouse test, whereas Search Console aggregates 28 days of real visits. For the assessment, rely on field data.
Is Elementor too heavy for good Core Web Vitals?
Not in itself. With containers, few add-ons, good hosting and caching, an Elementor website can meet the thresholds. Piled-up plugins and third-party scripts are the usual culprits.
How long does it take to see the effect of optimisations?
The effect is immediate in Lighthouse, but field data covers 28 days: allow about a month. Any impact on rankings then depends on many other factors.
A fast WordPress website with Uteek
At Uteek, a digital agency based in Les Berges du Lac 2, Tunis, performance is part of every web development project and every SEO/GEO engagement. Explore our work or let’s talk about your Core Web Vitals.
Related articles

SEO and GEO in 2026: how to get your website found on Google and cited by AI assistants
GEO doesn't replace SEO, it builds on it. Here is a practical method to get your website found…
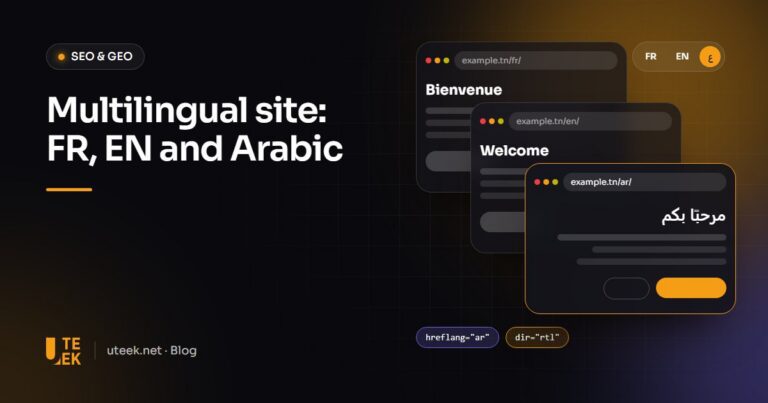
Multilingual website in French, English and Arabic: SEO and UX best practices
One URL per language, hreflang tags, keyword research in each language and a proper right-to-left layout: best practices…

Google Business Profile: the complete guide to optimising your listing and attracting local customers
Categories, opening hours, photos, reviews, consistency with your website… A complete Google Business Profile gets you seen on…