


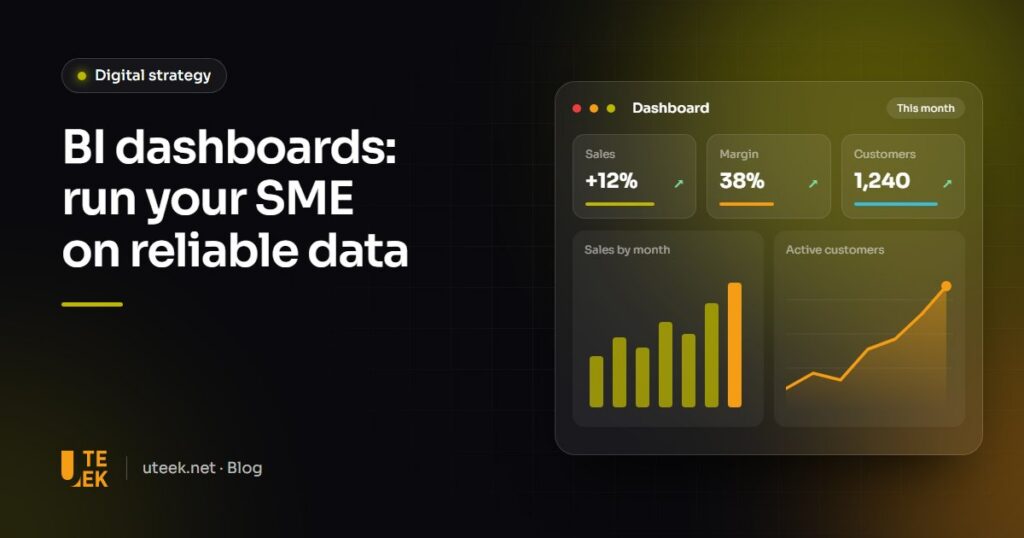
Useful business intelligence dashboards do not show all your data: they answer, at a glance, the questions that drive your decisions. Business intelligence (BI) gathers data from your tools (ERP, CRM, accounting, Excel files), makes it reliable and presents it as automatically refreshed indicators. For an SME, success depends less on the tool than on the method.
Key takeaways
- A dashboard starts from the decisions to be made, not from the data available.
- Five to seven KPIs per dashboard, each with a definition, an owner and a target.
- Reliable data from a single source of truth matters more than the tool.
- Power BI, Data Studio, Metabase or Tableau: choose according to your ecosystem and skills.
What is business intelligence?
Business intelligence covers the methods and tools that turn raw data into actionable information: collecting, cleaning and connecting data, then presenting it in dashboards, instead of consolidating spreadsheets by hand.
Indicator or KPI: what is the difference?
An indicator is a measurement, such as the number of orders or the average basket. A KPI, or key performance indicator, is an indicator linked to an objective and tracked against a target. Only a few indicators deserve that status.
How do you build a useful dashboard?
1. Start from decisions
List the decisions to inform and turn each one into a precise question: “Which products are at risk of running out this month?”. An indicator that answers no question does not belong there.
2. Choose 5 to 7 well-defined KPIs
Beyond that, attention scatters. For each KPI, document the formula, source, refresh frequency, owner and target: without a shared definition, two departments will report two different figures.
3. Map your data sources
ERP, CRM, accounting, e-commerce platform, Google Analytics, Excel files: note where each dataset lives, who enters it and how to extract it (connector, API, export).
4. Make the data reliable
Duplicates, categories that differ from one tool to another: without cleaning, a dashboard displays wrong figures with great precision. Designate a single source of truth for each data type (the CRM for customers, the ERP for stock) and fix errors at source.
5. Connect and model
For a few sources, the connectors built into BI tools are enough. Beyond that, a data warehouse (for example PostgreSQL or BigQuery) centralises the history, and modelling links the tables so every calculation stays consistent.
Which business intelligence tool should you choose?
| Tool | Positioning | Strengths | Points to plan for |
|---|---|---|---|
| Microsoft Power BI | Microsoft 365 and Excel ecosystem | Powerful modelling, Copilot depending on the licence | Power BI Desktop is free, report sharing is generally paid |
| Google Data Studio (formerly Looker Studio) | Google ecosystem: Analytics, Ads, Sheets, BigQuery | Free, quick to learn | Limited for complex models; paid Pro edition |
| Metabase | Open source, can be self-hosted | Simple for business teams, Metabot AI assistant | Hosting to manage, or a paid cloud offer |
| Tableau (Salesforce) | Advanced visual exploration | Rich visualisations, large community | Licences and learning curve to assess |
Looker Studio returned to its original name, Data Studio, in April 2026, according to Google Cloud’s announcement.
How do you design a readable dashboard?
- A clear hierarchy: main KPIs at the top, details below.
- Comparisons: a figure on its own says nothing; show the gap to target or to the previous period.
- Few colours: reserved for meaning, such as red for an unfavourable gap.
- The right chart: a line for a trend, bars for a comparison, a table for detail.
Refresh frequency, access rights and routines
Match the refresh frequency to the decision (daily for stock, monthly for profitability) and restrict access to sensitive data. Above all, review the dashboard in a regular routine, such as the monthly management meeting.
Dashboard examples by function
| Function | Key questions | Example KPIs |
|---|---|---|
| Management | Are we hitting our targets? Is our cash position sufficient? | Revenue vs target, gross margin, available cash |
| Sales | Which customers and products drive growth? | Sales per rep, quote conversion rate |
| Marketing | Which channels bring in profitable customers? | Cost per lead, conversion by channel, customer acquisition cost |
| E-commerce | Where are we losing sales? | Conversion rate, average order value, cart abandonment |
| Operations and logistics | Are we delivering on time? | On-time deliveries, stock-outs, stock turnover |
Pitfalls to avoid
- Too many KPIs: twenty indicators on one screen is a report, not a dashboard.
- Vanity metrics: followers or page views look good but inform no decision.
- Manual consolidation in Excel: slow and error-prone. Automate data collection.
- No owner: a KPI without an owner is neither explained nor corrected.
Where does artificial intelligence help?
AI extends BI in three ways: forecasting (sales, demand, cash flow), anomaly detection (a drop in orders, unusual spending) and natural-language questions, offered for example by Copilot in Power BI or Metabot in Metabase. Its limit: a forecast needs a clean and sufficiently long history, and a natural-language answer is only reliable if the indicators are properly defined.
FAQ
Does an SME need a data warehouse?
Not necessarily: with a few sources and modest volumes, the connectors in BI tools are enough. A data warehouse becomes useful as sources and history grow.
Can Excel be used as a dashboard?
Yes, to start with, if the data is imported automatically, for example with Power Query. As soon as several people view the figures with different access rights, a BI tool becomes more reliable.
How long does it take to set up a dashboard?
It depends mainly on the state of your data, as cleaning it often takes most of the time. Start with one function, then expand.
Who should own the dashboards?
Each KPI has a business owner who explains its variations. Technical maintenance can be outsourced, but defining the indicators is a management decision.
Run your SME on data with Uteek
Uteek supports SMEs from scoping to delivery: specifications, custom web application development and the integration of data analysis and forecasting models into your business tools, sharing only the data that is strictly necessary. Tell us about your project.
Related articles
How much does a website or app cost? The factors that drive the price
Project type, features, design, content, integrations, technology: what really drives the price of a website or app, and…
How to choose a web agency in Tunisia: 10 criteria for a successful project
Portfolio, method, UX/UI, SEO, maintenance, code ownership… The 10 criteria to check and the questions to ask before…
How to choose a CRM for your SME and connect it to your website
Leads lost in inboxes, forgotten follow-ups, no view of the pipeline: how to choose a CRM that suits…